Blog

valeriebartell.com

Viewing posts from the valeriebartell.com category

Boulder County December 2016 Update

map

Overview

Boulder County is part of the seven-county Denver Metropolitan Area. Boulder County is an ecologically diverse county with arid plains, foothills and mountainous terrain, providing good access to the state’s many natural recreational amenities for local residents and tourists. The area’s early settlement and development utilized the plains setting for agriculture and ranching as well as the mountains for mining and prospecting. The major cities in Boulder County are Boulder (county seat), Superior, Louisville, Lafayette Longmont and Erie (the last two partly in Weld County).  Boulder is home to the University of Colorado founded in 1876 as Colorado’s first university and is a large influence on the county’s economy. Boulder County’s economy include such industries as aerospace, bioscience, data storage, natural and organic products, outdoor recreation, renewable energy, software and tourism.

Transportation

Boulder County is approximately 25 miles from Denver. The major transportation route into Boulder County from Denver is Highway 36 also known as the Boulder Turnpike. The Boulder Turnpike was originally a toll road from its opening in 1952 until 1967. Highway 36 continues north through the City of Boulder to Lyons. Another major thoroughfare following the foothills from Golden to Boulder is Highway 93. There have been suggestions to expand E470 into Boulder County to Jefferson County, completing the Metropolitan Denver 470 Interstate loop, but concerns have been raised from citizens in Boulder County and Jefferson County about traffic and funding. State highway 287 runs north/south and connects Highway 36 in Broomfield (Broomfield County) with Lafayette and Longmont in the northeast portion of Boulder County. The primary east/west routes within Boulder County are Highway 7, Highway 52 and Highway 66. The Diagonal Highway (Highway 119) is the main thoroughfare between north Boulder, Gunbarrel and Longmont.

Economic Indicators

The following is from the September 2016 (the most recent available) Economic Indicators Report published by the Boulder Economic Council, and the October 2016 labor market indicators from the Colorado Department of Labor.  For statistical purposes, Colorado Department of Labor reports relied upon the Boulder-Longmont Metropolitan Statistical Area (MSA) for reporting.

Employment

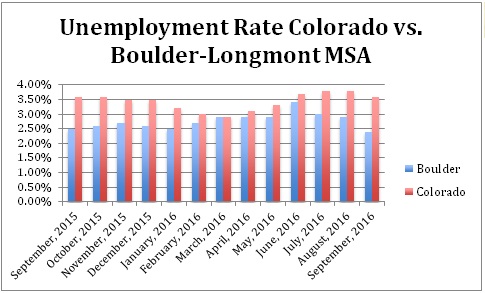
Boulder County’s unemployment rate in October 2016 was recorded as 2.4 percent. The unemployment rate in Boulder is down 0.5 percent over the prior month, and at its lowest level since December of 2000. There are currently 8,669 jobs available in the Boulder-Longmont MSA job market, and unemployment in the Boulder market is consistently below Colorado’s overall unemployment rate.

graph

The largest employment sectors in the Boulder-Longmont MSA include Government (Federal, State and Local) of 20.29 percent, Professional and Business Services of 18.01 percent, and Educational and Health Services of 13.0 percent.

Below are the top 10 industries by projected growth for the Boulder-Longmont MSA for the 2015 – 2025 time period

industries

Total Boulder employment increased by 1.67 percent month-over-month in September 2016.   Total employment in Boulder expanded by 4,784  jobs, or 2.76 percent, year-over-year in September 2016.

long

Business Confidence

The Leeds Business Confidence Index, based on Colorado business leaders’ expectations, dropped slightly from 55.4 in the second quarter of 2016 to 54.6 anticipated for the third quarter of 2016, still indicating positive expectations. The Leeds Business Confidence Index has been above 50 since 1 Q 2012. 

Venture Capital Investment

In 1 Q and 2 Q 2016, Boulder companies received $29.5 million in venture capital investment, representing approximately 24 percent of all investment in Colorado.  Since 1 Q 2014, Boulder companies have received $504 million in venture capital investment, representing approximately 30 percent of all Colorado venture capital investments.

Residential Real Estate

The number of single-family homes sold year-to-date in Boulder was down 11.6 percent over the same period in 2015; however, the median single-family home price was up 14.67 percent over the same time last year, and 31 percent since 2014.

In the residential rental market, apartment vacancies were 5.9 percent for Boulder and Broomfield Counties in 2 Q 2016, compared to 6.6 percent in the previous quarter.

Commercial Real Estate

Commercial vacancy rates have been in the single digits in Boulder Colorado since 1 Q 2013. Office vacancies have increased slightly from 4.3 percent vacancy in 2 Q 2015 to 6.4 percent in 2 Q 2016. In the same time, industrial vacancy has gone from 2.6 percent to 3.9 percent.  These increases are partially due to new inventory on the market.  Retail vacancies have lowered 218 percent to 1.7 percent in 2 Q 2016.

Gross Domestic Product

According to the Bureau of Economic Analysis, the nominal gross domestic product (GDP) for Boulder County was an estimated $23.4 billion in 2015. GDP grew 5.3 percent between 2014 and 2015.

Boulder Colorado MSA GDP by year (2001 – 2015) 

msa

Retail Sales Tax Collection – City of Boulder

Retail sales, reflected by the city sales tax collections, have continued to increase after slipping in 2008 and 2009. Much of the increase in retail sales in 2007 can be attributed to the opening of the Twenty Ninth Street Shopping District in late 2006.

retail

Tourism

Boulder is a popular destination for local and out of state visitors, and tourism is a significant contributor to the Boulder economy. Despite its location at the foot of the mountains, Boulder has an urban feel and offers an impressive variety of art, cultural, and entertainment choices that set it apart from most cities its size. Boulder has more than 30 art galleries and has been recognized as one of the nation’s top cities for art. Boulder is home to five local museums, 32 movie and stage theaters, a resident symphony, and offers a notable number and variety of cultural events. The city’s dining and craft brewing scenes have exploded and Boulder is now a nationally recognized dining destination. Boulder’s commitment to supporting small, unique merchants as well as national retailers has helped create an appealing array of shopping choices.

Tourism in Boulder is supported by the presence of the University of Colorado as well as the city’s surroundings and amenities. The area offers scenic beauty, great weather, and abundant recreational opportunities. Boulder is surrounded by over 45,000 acres of open space and has over 150 miles of public hiking and biking trails including the Boulder Creek Path, a trail featuring pedestrian and bicycle lanes that runs through the middle of town. Boulder Canyon is only a 10‐minute drive from downtown Boulder; Eldora Mountain Resort, Eldorado Canyon State Park, and Rocky Mountain National Park are less than an hour away. Each year, the city hosts one of the nation’s largest 10k races, the Bolder Boulder. In 2015 Boulder hosted one leg of the IRONMAN circuit and a Republican debate which took place in the University of Colorado’s Coors event center.

Hotel occupancy rates, average daily room rates, and average revenue per available room, as well as sales tax receipts for select categories and shopping areas provide further insight into the city’s tourism activity. Average hotel occupancy rates in the city have been improving and remain consistently higher than state and national averages for cities with similar characteristics.  Average daily rates in the city are lower than the Colorado ski average and higher than the national average for cities with similar characteristics to Boulder.

Demographics

The following are 2016 and 2021 estimates for Boulder County and were provided by the CCIM/STDB (from December 2016, the most recent available):  

Population

In the identified area, the current year population is 316,987. In 2010, the Census count in the area was 294,567. The rate of change since 2010 was 1.18 percent annually. The five-year projection for the population in the area is 338,316 representing a change of 1.31 percent annually from 2016 to 2021. Currently, the population is 50.2 percent male and 49.8 percent female.

Households

The household count in this area has changed from 119,300 in 2010 to 127,213 in the current year, a change of 1.03 percent annually. The five- year projection of households is 135,615, a change of 1.29 percent annually from the current year total. Average household size is currently 2.41, compared to 2.39 in the year 2010. The number of families in the current year is 73,270 in the specified area.

Housing

Currently, 56.4 percent of the 135,006 housing units in the area are owner occupied; 37.9 percent renter occupied; and 5.8 percent are vacant. Currently, in the U.S., 55.4 percent of the housing units in the area are owner occupied; 32.9 percent are renter occupied; and 11.7 percent are vacant. In 2010, there were 127,071 housing units in the area – 59.0 percent owner occupied, 34.9 percent renter occupied, and 6.1 percent vacant. The annual rate of change in housing units since 2010 is 2.73 percent. Median home value in the area is $423,986, compared to a median home value of $198,891 for the U.S. In five years, median value is projected to change by 1.25 percent annually to $451,082.

Income

Current median household income is $69,924 in the area, compared to $54,149 for all U.S. households. Median household income is projected to be $80,516 in five years, compared to $59,476 for all U.S. households. Current average household income is $99,491 in this area, compared to $77,008 for all U.S. households. Average household income is projected to be $109,042 in five years, compared to $84,021 for all U.S. households. Current per capita income is $40,436 in the area, compared to the U.S. per capita income of $29,472. The per capita income is projected to be $44,186 in five years, compared to $32,025 for all U.S. household.

Conclusion

Boulder County’s economy is strong, and continues to outpace Colorado overall in terms of unemployment.  The strength of Boulder’s economy is further evidenced by a high percentage of venture capital investment relative to the state of Colorado overall, and continued GDP growth year over year.  Housing continues to be strong, with low rental vacancy rates, and a 31 percent increase in the price of single-family housing since 2014. Boulder’s economic strength is also reflected through commercial real estate with office, industrial and retail vacancies all below 4.5 percent.

Given almost all economic indicators researched appear to be strong, it is anticipated that economic strength will continue into the near future.


Keep in contact!

As my business grows, I’d love to be able to keep my connections with my past clients, and make new acquaintances along the way.  Completing the form below will allow me to keep in contact with you.  Your information will not be shared with anyone else.


[contact-form-7]

Opt-Out Mailer Portal

Not a fan of paper mail? I understand.

Fill out the form below and I will promptly remove you from my mailing list. If you’d like to receive updates via e-mail on recent neighborhood sales, you can fill out this form and I’ll set you up for e-mail updates instead. Thanks for checking in and allowing me the chance to help you go green!

[contact-form-7]

Avoid Becoming an Identity Thief’s Next Victim

ID theft title page

More than 17.6 million Americans were victims of identity theft in 2014 alone. Most victims discovered their information had been compromised when their banks contacted them about suspicious activity. Thieves are more sophisticated than ever, often using technology to help them steal information. Other times, they prey on the trusting nature of people to procure personal information.

85% of Americans took steps to prevent identity theft, such as shredding documents, checking their credit reports and changing their passwords.

BEWARE OF ATM SKIMMING

If you use an ATM or other card reader, you may become a victim of identity theft and not realize it until you look at your account statement. Thieves have been using counterfeit card readers in tandem with hidden cameras to steal the information on ATM cards for several years. Once you slide your card into the reader and punch in your PIN, the thief has enough information to make another card. Incidents were up 546% in 2015, with more than 60% of incidents occurring at non-bank ATMs. While more financial institutions are incorporating EMV chips into their debit and ATM cards, which make it more difficult to counterfeit a card, not all of them have converted yet. Reduce your risk by avoiding non-bank ATMs and monitoring your accounts for unauthorized activity.

MEDICAL IDENTITY THEFT IS ON THE RISE

More than two million Americans are victims of medical identity theft each year. This type of theft costs the average victim $22,346. Thieves steal a person’s name and social security number or Medicare number to receive medical care, drugs or to submit false Medicare claims. Unfortunately, a victim may not realize it’s happened until they get a bill for a medical service they didn’t receive or collection notices for bills they know nothing about.

Prevent Medical Identity Theft

• Be wary of giving out personal information.

• Keep paper copies of your insurance records and forms locked away in a safe place.

• Shred documents you want to throw away.

• Remove or destroy the labels on prescription pill bottles before you dispose of them.

WHAT SHOULD YOU DO IF YOU’RE THE VICTIM OF IDENTITY THEFT?

1. Report it to your local police and ask them to issue a police report. Keep a copy of it to share with your creditors.

2. Document everything, from phone calls to emails, pertaining to the incident.

3. Contact the fraud department at one of the major credit bureaus—Equifax, TransUnion or Experian— to place a fraud alert on your file. One bureau will notify the other two of the flag on your credit.

4. Review your credit report and look for unauthorized charges or new credit lines.

5. Contact your creditors, financial institution, utilities and services to let them know your identity has been stolen.

6. Contact the IRS if you think your identity has been used in connection with tax violations.

7. Contact the postal service to see if anyone has submitted change of address forms on your behalf.

Don’t Fall Prey to These Scams

Although 85% of people who reported a scam didn’t fall for it, the cumulative losses of victims totaled more than one trillion dollars in 2015. If you suspect you’ve been contacted by a scam, use the Scam Tracker from the Better Business Bureau to report it.

BEWARE OF THESE COMMON SCAMS

• Tax scams comprised more than 24% of reported scams in 2015. Thieves call to say you owe back taxes and will be arrested if you withhold payment. In reality, the IRS won’t call you if you owe money and won’t threaten you to get it.

• Debt collection scams made up 8.3% of scams reported in 2015. Thieves call to say you have unpaid debt and threaten you with lawsuits or arrest if you don’t pay. If you receive such a call, request written evidence of your debt. The law states you can request validation of your debts in writing. True debt collectors won’t threaten you or require you pay your debts immediately.

• Credit card scams made up 3% of reported scams in 2015. Thieves contact you claiming to be from your credit card company and offer you a lower interest rate on your credit card, but only if you “verify” a transaction or your card number and security code.

• Sweepstakes and prize scams may be one of the oldest tricks in the book, but they comprised 8% of scams reported in 2015. Thieves contact you to tell you you’ve won a prize, but you have to pay a fee or cover delivery and processing to claim it. If you have to pay money upfront for your prize, it’s not a real prize.

• Tech support scams comprised 6% of reported scams in 2015 and are becoming more common. Thieves contact you claiming to be computer technicians who have detected a virus or security threat to your computer. They’ll say they can get rid of it, but they have to access your computer remotely. In reality, they’re trying to steal your password and personal information.

Tips to Avoid Being the Victim of a Scam

1. Beware of claims that require immediate action.

2. Beware of offers that require you to wire money or send a pre-paid card.

3. Trust your gut—if you feel something is wrong or an offer sounds too good to be true, it’s probably a scam.


Ways to Protect Your Child from Identity Theft

Since children are financial “blank slates,” their information is an ideal target for thieves. Unfortunately, parents may not realize their child’s identity has been stolen until the child tries to open a bank account or apply for a job.

4 Ways to Protect Your Child from Identity Theft

1. Don’t give away their personal information, over the phone or online.

2. Keep their identity documents, such as their birth certificate and social security card, in a safe or locked filing cabinet.

3. Teach your children to protect their personal information.

4. If you suspect your child’s identity has been stolen, contact the police and credit bureaus.


© 2016 Buffini & Company. All Rights Reserved. Used by Permission.

Buy This Not That

Sticking to a budget, getting out of debt, and saving up for an emergency fund can be overwhelming tasks. And depending on how aggressively you are working on these goals, you may have eliminated many luxuries from your life. But with a little bit of creativity, you can bring back some of the luxuries into your daily lifestyle. Instead of buying the luxury itself, we present some budget friendly alternatives.


  1. Instead of buying beer, consider taking up craft brewing as a hobby.

Cost for a 12 pack of craft beer: $17.99

Cost to make a 12 pack of craft beer: $14.00

Annual Savings: $207.48


For most singles, and those without children, a big part of the entertainment budget is devoted to social drinking. Here, we already assume you’ve cut out visits to the bar, and just want to kick back a couple of days during the week and have a beer or two with your neighbors or friends. Taking up a hobby like craft brewing gives you more advantages than just saving money. It becomes a conversational topic when you are visiting with friends and neighbors, and it gives you a hobby with results that can be quickly enjoyed.


  1. Instead of visiting the Redbox, check out your local library’s vast DVD library.

Cost to rent 3 movies per week for 2 nights: $7.20

Cost to check out 3 movies per week from the library: $0.00

Annual Savings: $312.00


Another great way to offset a family entertainment budget is to do a lot more entertaining in. And as long as the movie is the same, why not get it from a free source like the public library? Most libraries have extensive DVD collections, and even allow patrons to reserve a DVD title online, and receive notifications when it is their turn to view a title. As long as you can return movies on time, you will have a supply of free entertainment as big as your local library can hold.


  1. Instead of buying face scrubs and skin moisturizers, make your own from

in-season ingredients.

Cost of a facial scrub cleanser: $8.39

Cost to make facial scrub from raw ingredients: $2.00

Annual Savings: $76.68


For women, an added balancing point when creating a budget is trying to figure out which personal care items should be kept and which items can be pared down. Some items, however, do not need to be eliminated entirely. Those facial scrubs that you favored because they contained natural ingredients, can be made at home (naturally). Next time you’re in the kitchen, consider making an exfoliating facial scrub from brown sugar, pureed blueberries and lemon juice. If your hands are feeling dry, try making an exfoliating and moisturizing salt scrub from coconut oil and table salt.


  1. Instead of paying for a gym membership, use the free gym around you

Cost of a gym membership: $30 per month

Cost to work out in your natural surroundings: Free

Annual Savings: $360


Instead of paying for the latest gym craze like Crossfit, find ways to achieve your fitness goals outside of the gym. Instead of lifting huge tires like those in Crossfit, you can surely find something of increasing size in your neighborhood that you can lift for free. Take a walk or run through your local park, and if it gets dark too early in your part of the world, you can always look up aerobic exercises that can be done in the comfort of your home.


  1. Instead of going out to dinner or a bar with friends, consider having a game night at home.

Cost of one outing a month with friends: $40

Cost to host a game night at home: Free

Annual Savings: $400


Have your guests over for a “bring your own game” night. Besides changing it up from the usual bar scene, you will be able to converse with friends in a much more quiet atmosphere. If you don’t have any games to play, you can look up some low cost and free games here: http://www.moneycrashers.com/family-game-night-ideas-board-games/

Just don’t spend too much money on games or refreshments. The idea is to save some money.


  1. Begin a clothing exchange with your similarly sized friends.

Cost of one outfit every 3 months: $60

Cost to exchange one outfit: free


Take a stroll through your closet in the near future, and take inventory of your clothes. You probably have something, or maybe even a few somethings that are in reasonable shape, you just don’t wear anymore because it’s not your style. Next time you do this, set these clothes aside, and see if you have a similar sized friend you can do a clothing exchange with. It can be a fun and interesting way to refresh your wardrobe, and maybe even try a style that you’ve never considered.


These tips will help you rethink your discretional spending. By taking on some of life’s simple luxuries yourself instead of buying them, not only will you save money, but you will be able to unleash your creative talents

How to Find the Home That’s Right for You

Screen Shot 2016-05-04 at 12.28.24 PM

For the majority of homebuyers, finding the right property to buy is often the most difficult step of the home buying process—more difficult than saving for a down payment or getting a mortgage.(1) Before you start your search, consider these four important factors.

1. How much house can you afford? Knowing what you can afford will help you narrow your search to homes within your budget. The basic rule of thumb is that no more than 28% of your gross annual income should be applied to your mortgage, insurance and property taxes.

• Get pre-approved for a mortgage to help you define your price range.

• Make a list of expenses you’ll have when you become a homeowner, including homeowners’ association fees,

property taxes and private mortgage insurance.

• Factor in costs associated with continued upkeep and maintenance.

Looking for a quick estimate based on your finances? Visit Bankrate.com and use their “How Much Can I Afford”

calculator.

2. What type of home do you want? What features make up the ideal home for you and your family? How many bedrooms and bathrooms should it have? Do you want a pool? Do you want a detached home with a big yard or a condo with a patio? Conversely, what features would eliminate a home from your list of prospects? Knowing what you want, and don’t want, will help you focus your search on homes that fit your needs.

Top Reasons for Purchasing a Home (1)

1. Desire to own a home of their own

2. Desire for a larger home

3. Job-related relocation or move

4. Change in family situation

5. Desire to be closer to family/friends/relatives


The average home purchased in 2015 was a

detached, single-family, 2,000-square-foot home

with three bedrooms and two bathrooms. (1)


3. Location, location, location! Choosing real estate is more than whether you want to live in the city, in the suburbs or away from it all in a rural area. Your neighborhood matters. In fact, 59% of recent buyers said the quality of the neighborhood was the top factor influencing where they lived. (1) Whether you want a house in a great school district or one that’s convenient to health facilities, defining the qualities of your ideal neighborhood will help you narrow your search area.

Top 5 Factors Influencing Neighborhood Choice (1)

1. Quality of the neighborhood

2. Convenient to job

3. Overall affordability of homes

4. Convenient to friends/family

5. Design of neighborhood


4. What’s your lifestyle? Single homebuyers may have different needs than married buyers, or buyers with children, and all of these groups have different needs than retirees looking to downsize. What about you? Are you single and want to live in the heart of a busy urban area? Do you have one or more children and want to live in a family-oriented subdivision with a pool and recreation center? Perhaps you want your children to grow up near cultural amenities only found in urban areas. Your current stage of life, as well as your desired lifestyle, often influences the types of areas and neighborhoods that appeal to you. Once you determine your priorities, you can focus your home search to only those that match your desires.


Are you ready to start your home search? Let’s discuss it! Once you’ve defined what the right home looks like to you, pop into the office or call me and we’ll discuss your options and I’ll give you the scoop on what to expect during the process. Finding the right home can be a difficult process; however, with an experienced professional by your side, you’re sure to make the right decision.


Fact: Homeowners lived in their homes for a median of 9 years before selling. However, recent homebuyers say they expect to live in their homes 14 years. (1)

Top 3 Reasons Buyers Chose a Home (2)

1. Size

2. Room layout/design

3. Price (tie)

3. Neighborhood (tie)

Facts and Figures


Sources: 1. NAR 2015 Profile of Home Buyers and Sellers

2. NAHB, American Housing Survey 2015, July 1, 2015


(C) 2016, Buffini & Co. Reproduced with Permission.

RE/MAX Momentum Night at the Rockies!!!

You’re invited to see the Rockies play the Arizona Diamondbacks on Friday, June 24th, complements of RE/MAX Momentum.  To reserve your tickets please complete the form below:


[contact-form-7]

Basic Home Improvements that Save Money

Screen Shot 2016-03-03 at 10.01.01 AM

(C)2016 Reproduced with permission Buffini & Co.

In many areas of the country, energy and water costs are on the rise, taking a bigger chunk out of our wallets every month.

But, there’s hope. With a few home improvements, you may be able to save money on your utility bills.

Water

Whether you live in an area that’s facing another year of drought, or you just want to save money on your water bill, these tips can help you be efficient with your water.

Go low flow.

Showerheads and faucets account for more than 32% of household water use combined. (1) Low flow faucets and showerheads can reduce your water consumption in these areas by as much as 50% and may save up to $145/year on your bill. (2)

Fix leaks.

Leaks comprise 13.7% of household water use. (1) Leaky faucets and pipes increase your water bill and may require expensive repairs if they’re ignored. Every six months, inspect your faucets and pipes for wear and tear. If you notice a leak, fix it right away.

Go tankless.

If it’s time to upgrade your water heater, consider going tankless. A tankless water heater may help you save up to 20% on your water bill. (2) An added bonus: You’ll never run out of hot water again!

Energy

Heating and cooling comprises more than half of the energy used in the average home. (3) Regulate your home’s temperature to save energy, improve comfort and reduce your heating and cooling costs.

Rethink your insulation.

Good insulation not only helps regulate the temperature of your home, it can also reduce your heating and cooling costs by as much as 20%. (3)

Manage the temperature automatically.

Wouldn’t you love to come home to the perfect temperature? A programmable thermostat not only improves your comfort from the second you step foot in your home, it also helps you save energy and money—up to $150 a year. (3)

Seal up drafts.

Have you ever wondered why your home won’t stay warm in the winter or cool in the summer? Check your windows—drafty windows cause 30-40% of heating and cooling losses. Apply weather stripping to your windows to patch up leaks and save more money. (3)


Screen Shot 2016-03-03 at 10.08.39 AM

Upgrade Your Kitchen

The kitchen is the heart of the home. A kitchen remodel will not only improve your home’s functionality, it may also become a key selling point if you decide to sell. The average major kitchen remodel costs between $29,400 and $42,400, while the minor kitchen remodels average between $11,700 and $17,800. (4) However, if you’re thinking of listing your home soon and your kitchen is in good shape, you may want to rethink a full remodel. A minor upgrade and a coat of paint may be all you need to freshen up the space.

Upgrade Your Bathroom

The bathroom is the place where you get ready to take on the world every day. Show it some love with a makeover. Upgrade your fixtures to reflect your style, or create the spa-like getaway of your dreams. The average major master bathroom remodel costs between $10,500 and $18,800, while the average minor master bathroom remodel costs between $4,800 and $8,300. (4) Are you thinking of renovating a guest bathroom? Expect to spend somewhere of between $7,200 and $9,500 for a major overhaul, or between $3,200 and $4,400 for a minor remodel. (4)

Improve Energy Efficiency

Is it time to upgrade your appliances, windows and other energy-impacting parts of your house? Upgrading your home with energy-efficient features will not only save you money each month on your utility bill, it may also make the home more attractive to younger or more energy-conscious buyers.

Screen Shot 2016-03-03 at 10.12.04 AM


Sources:
1. Environmental Protection Agency, Water Sense, Water Use Today
2. US News, 8 Energy-Efficient Home Improvements that Save Money, May 31, 2013
3. U.S. Department of Energy, Energy.gov
4. Houzz, Houzz & Home, June 2015

Denver Metro Inventory Down 83% from 2011

According to statistics from REColorado.com, Denver Metro Housing inventory is hovering near five-year lows, down 83% from January 2011. The trend is even more pronounced for homes under $300,000 (a precious market for first time home buyers), where inventory is down 94%.

Screen Shot 2016-02-29 at 1.54.29 PMScreen Shot 2016-02-29 at 1.54.08 PM

What does this mean for the local housing market?  For sellers, expect to continue to see quick sales, with few concessions. And for those homes under $300,000, expect to see continued bidding wars.  The biggest hesitation for sellers? The ability to find a suitable replacement home.  For sellers moving from a sub-$300,000 home to a $300,000 + home, they may still be well-served in this market.  However, there are not many lateral moves available for those that cannot upgrade.

For buyers, getting an offer accepted will continue to be a challenge.  Those asking for concessions may be well served to find their own unlisted inventory.  The days of writing “love-letters” to sellers are over, as sellers may have to contend with a dozen equally lovable buyers.

The biggest winners will be current homeowners that can leverage newfound equity at historic low interest rates via a refinance.

How do you take advantage of this quick moving market? For a no-obligation personal consultation call me today. (303) 578-2329.